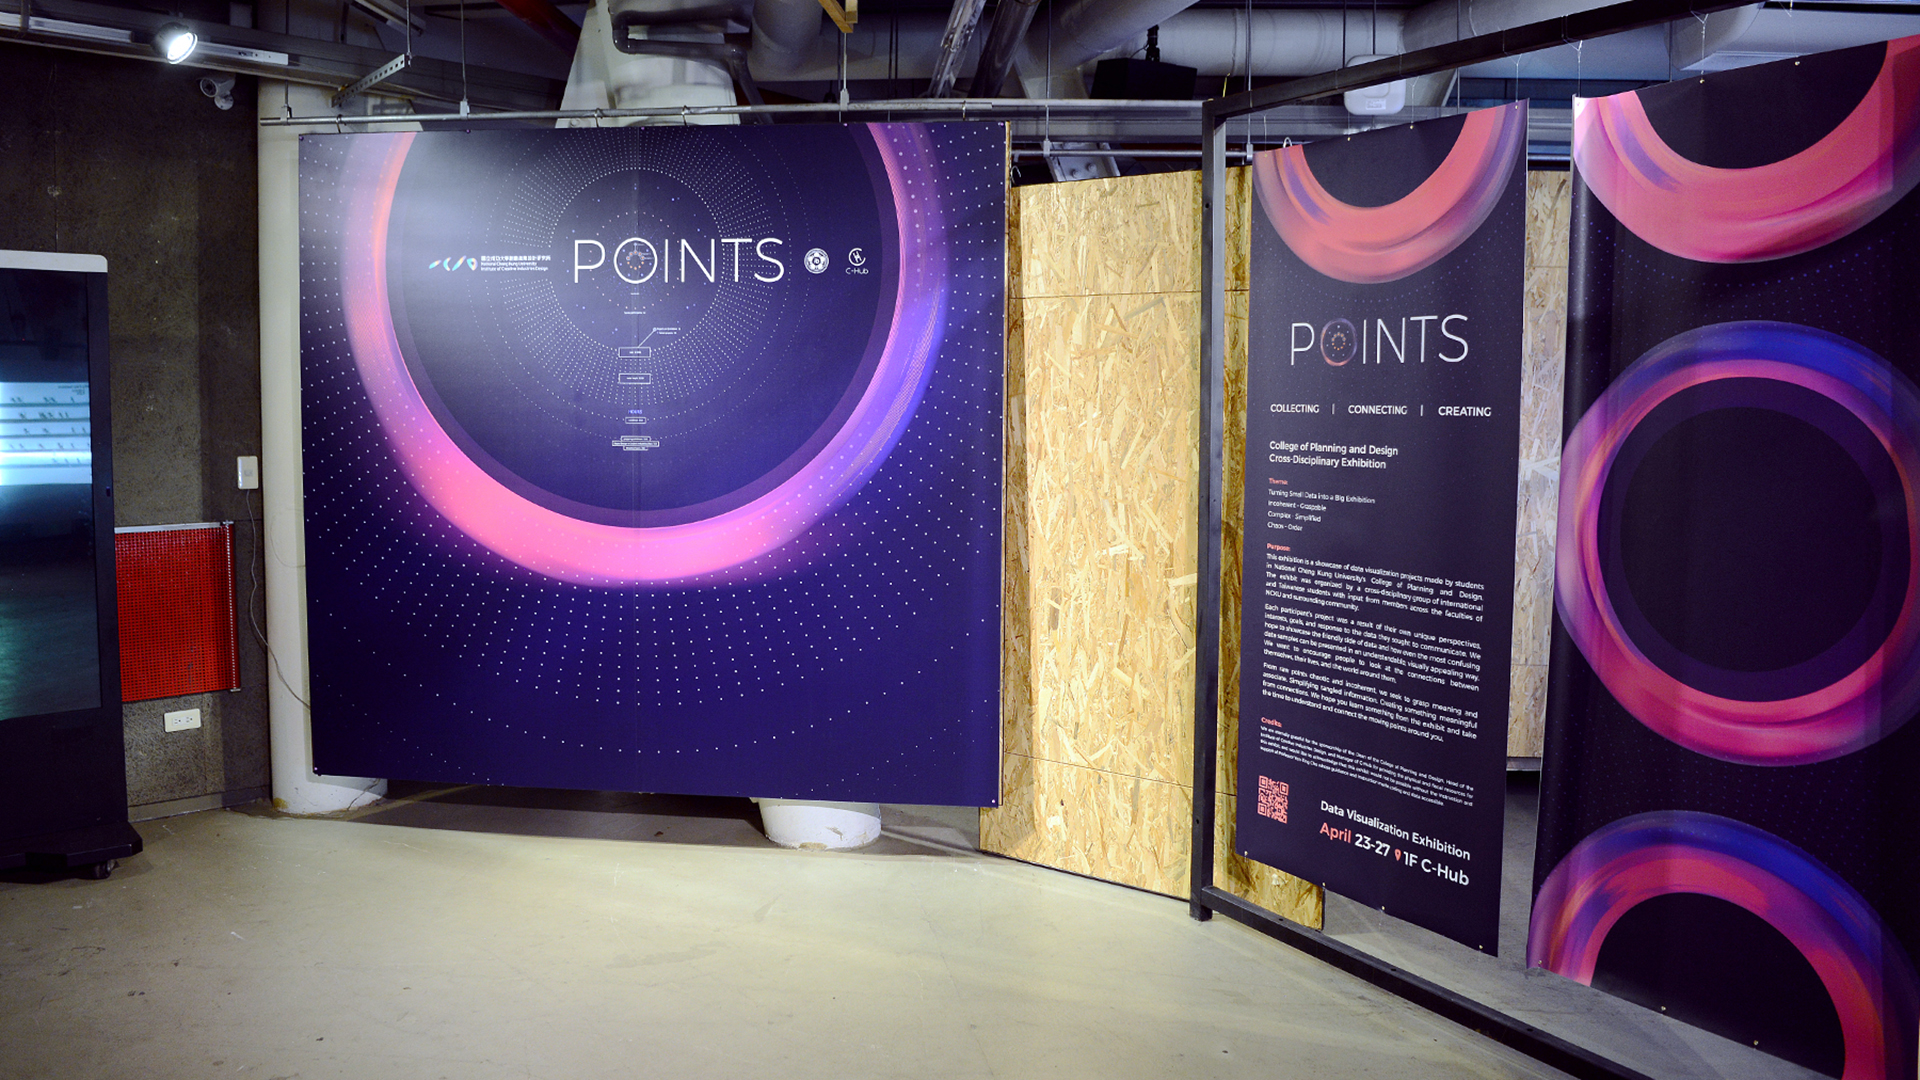
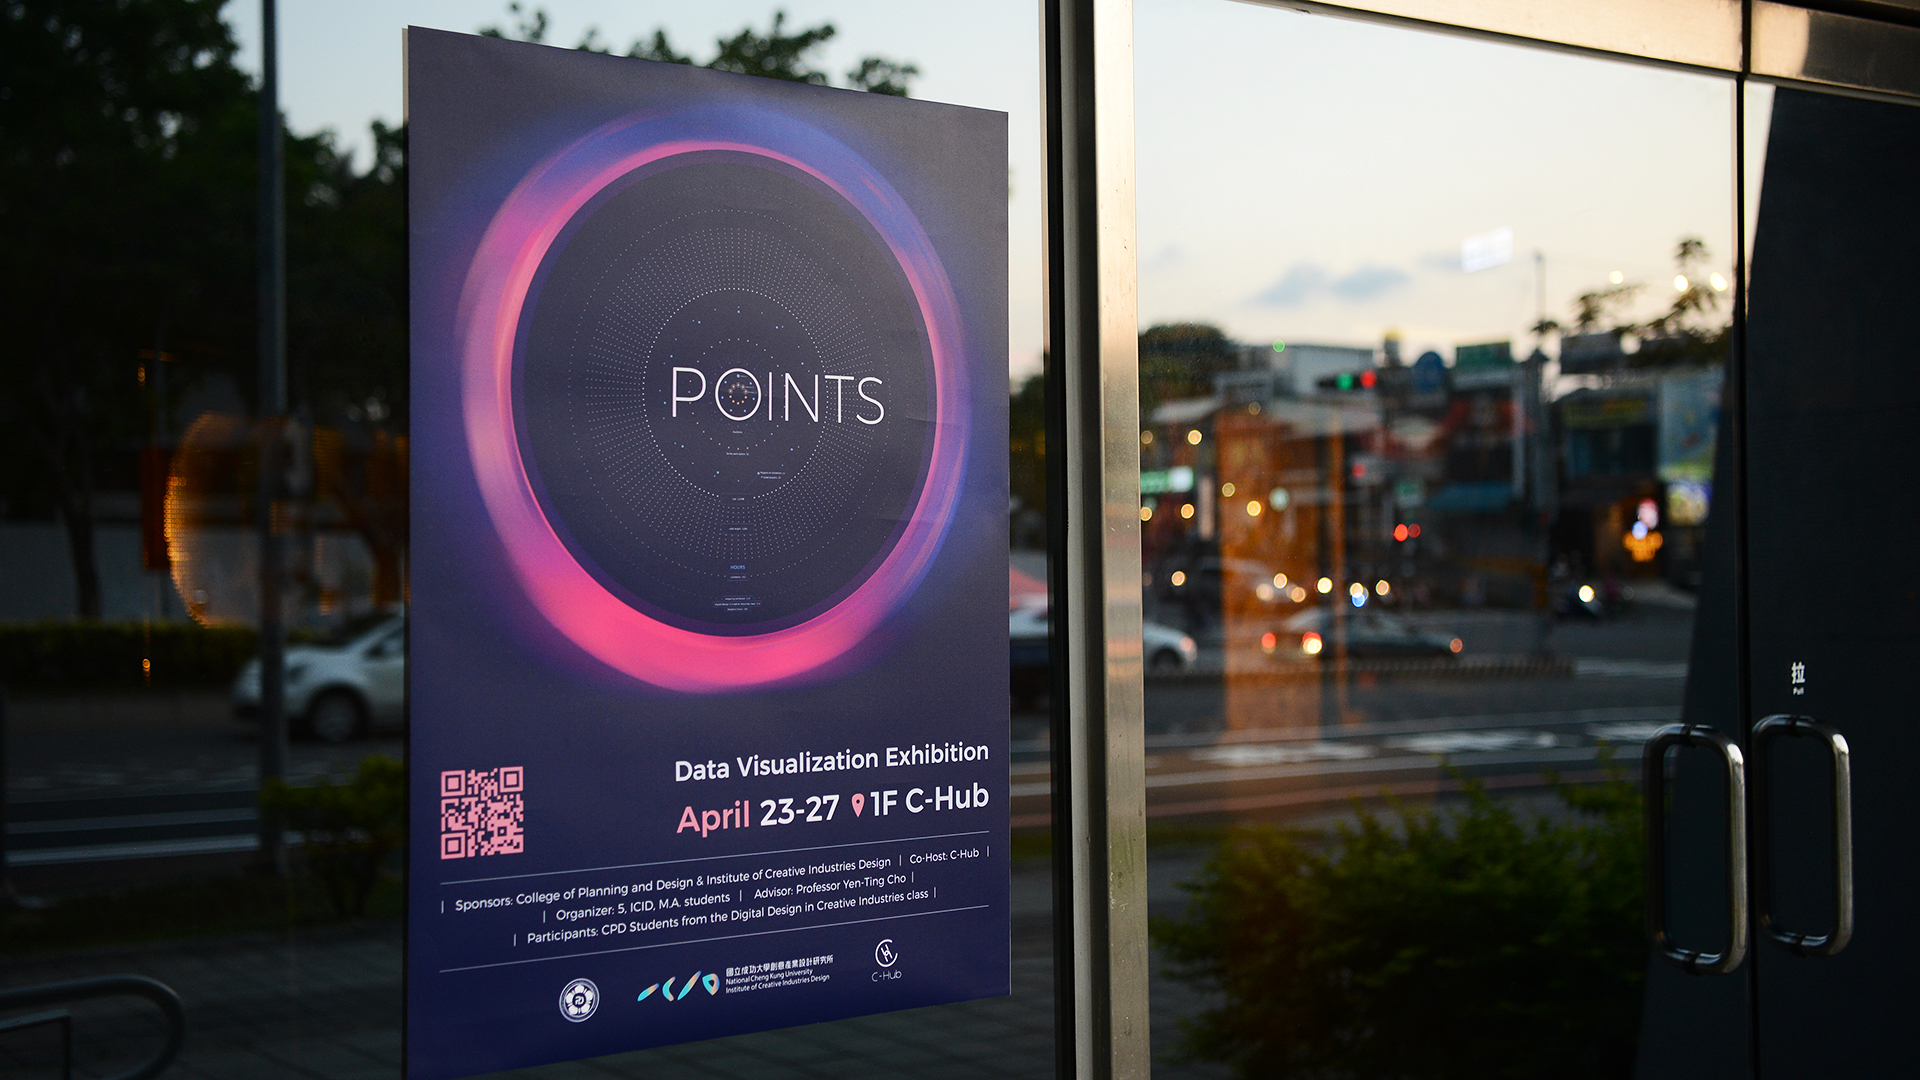
POINTS Data Visualization Exhibition: Turning Small Data into a Big Exhibition
Data is all around us but often seems quite complex and detached.
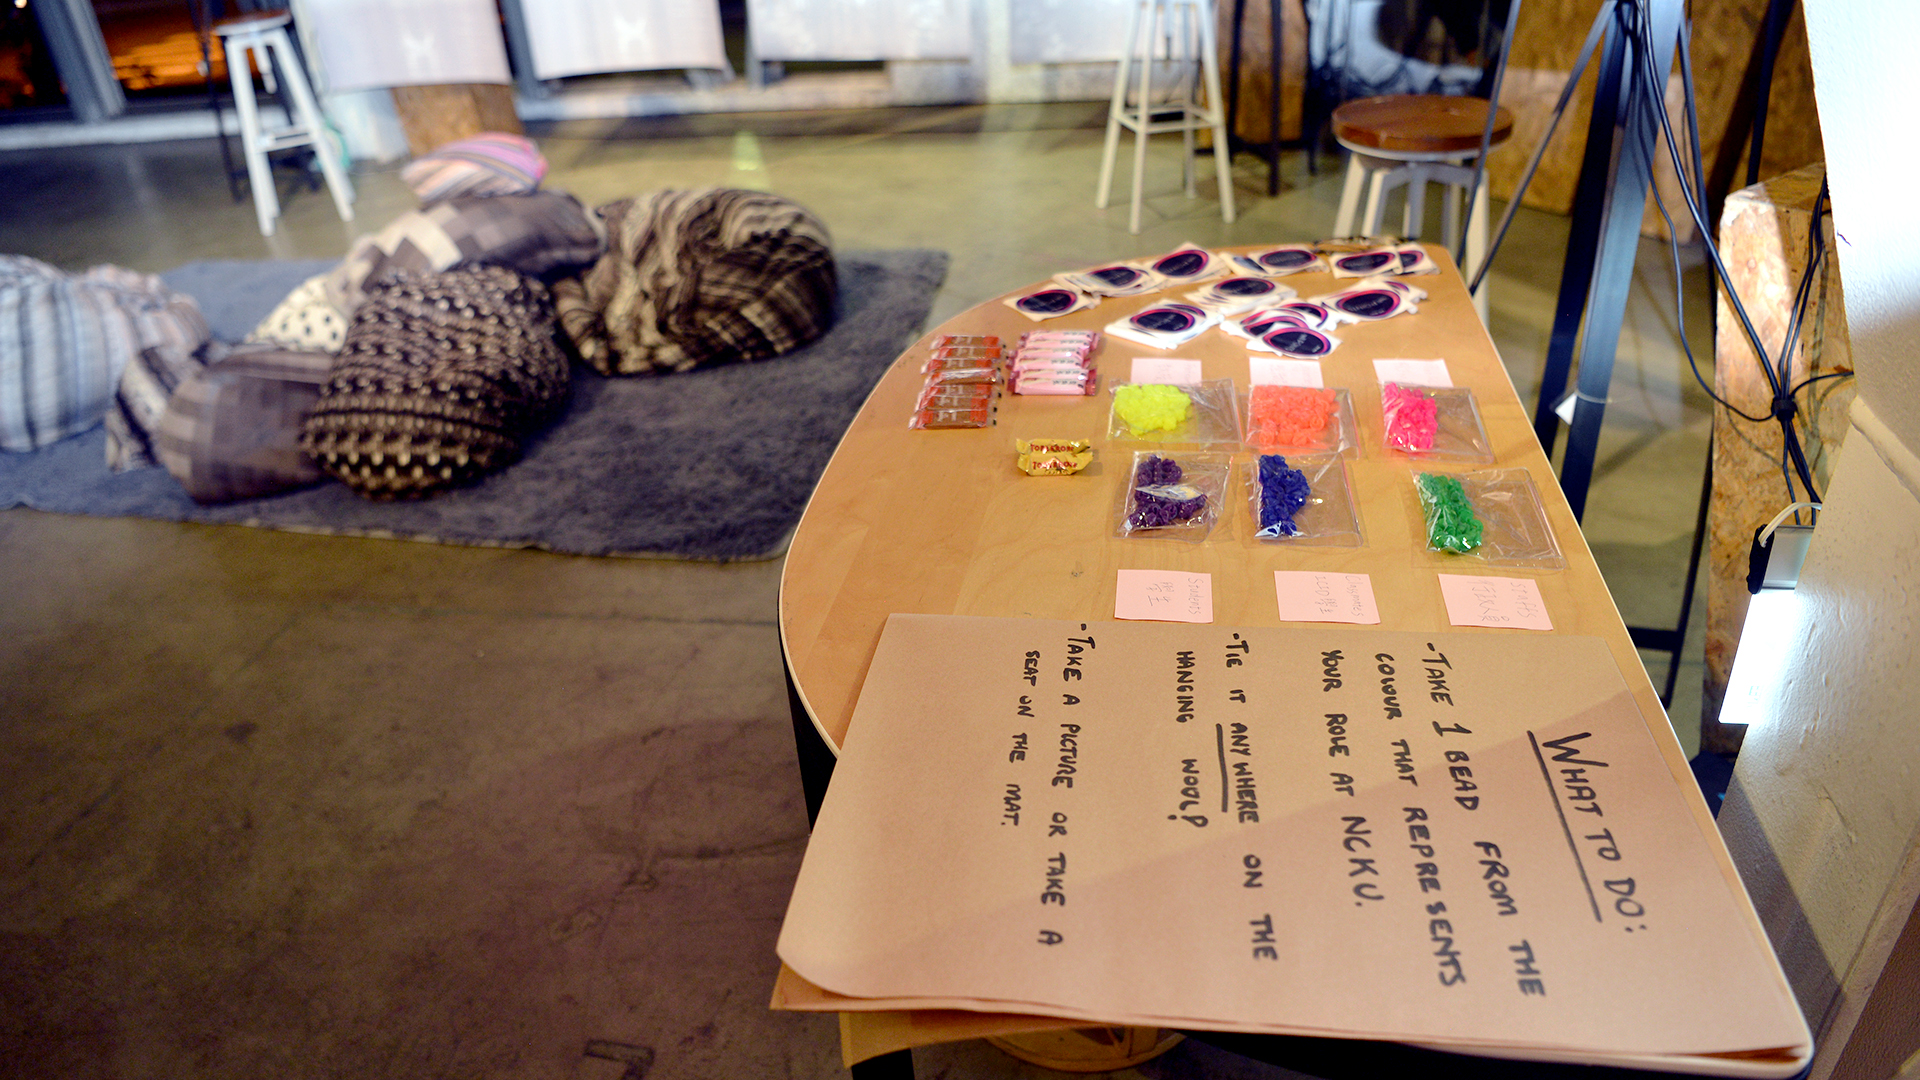
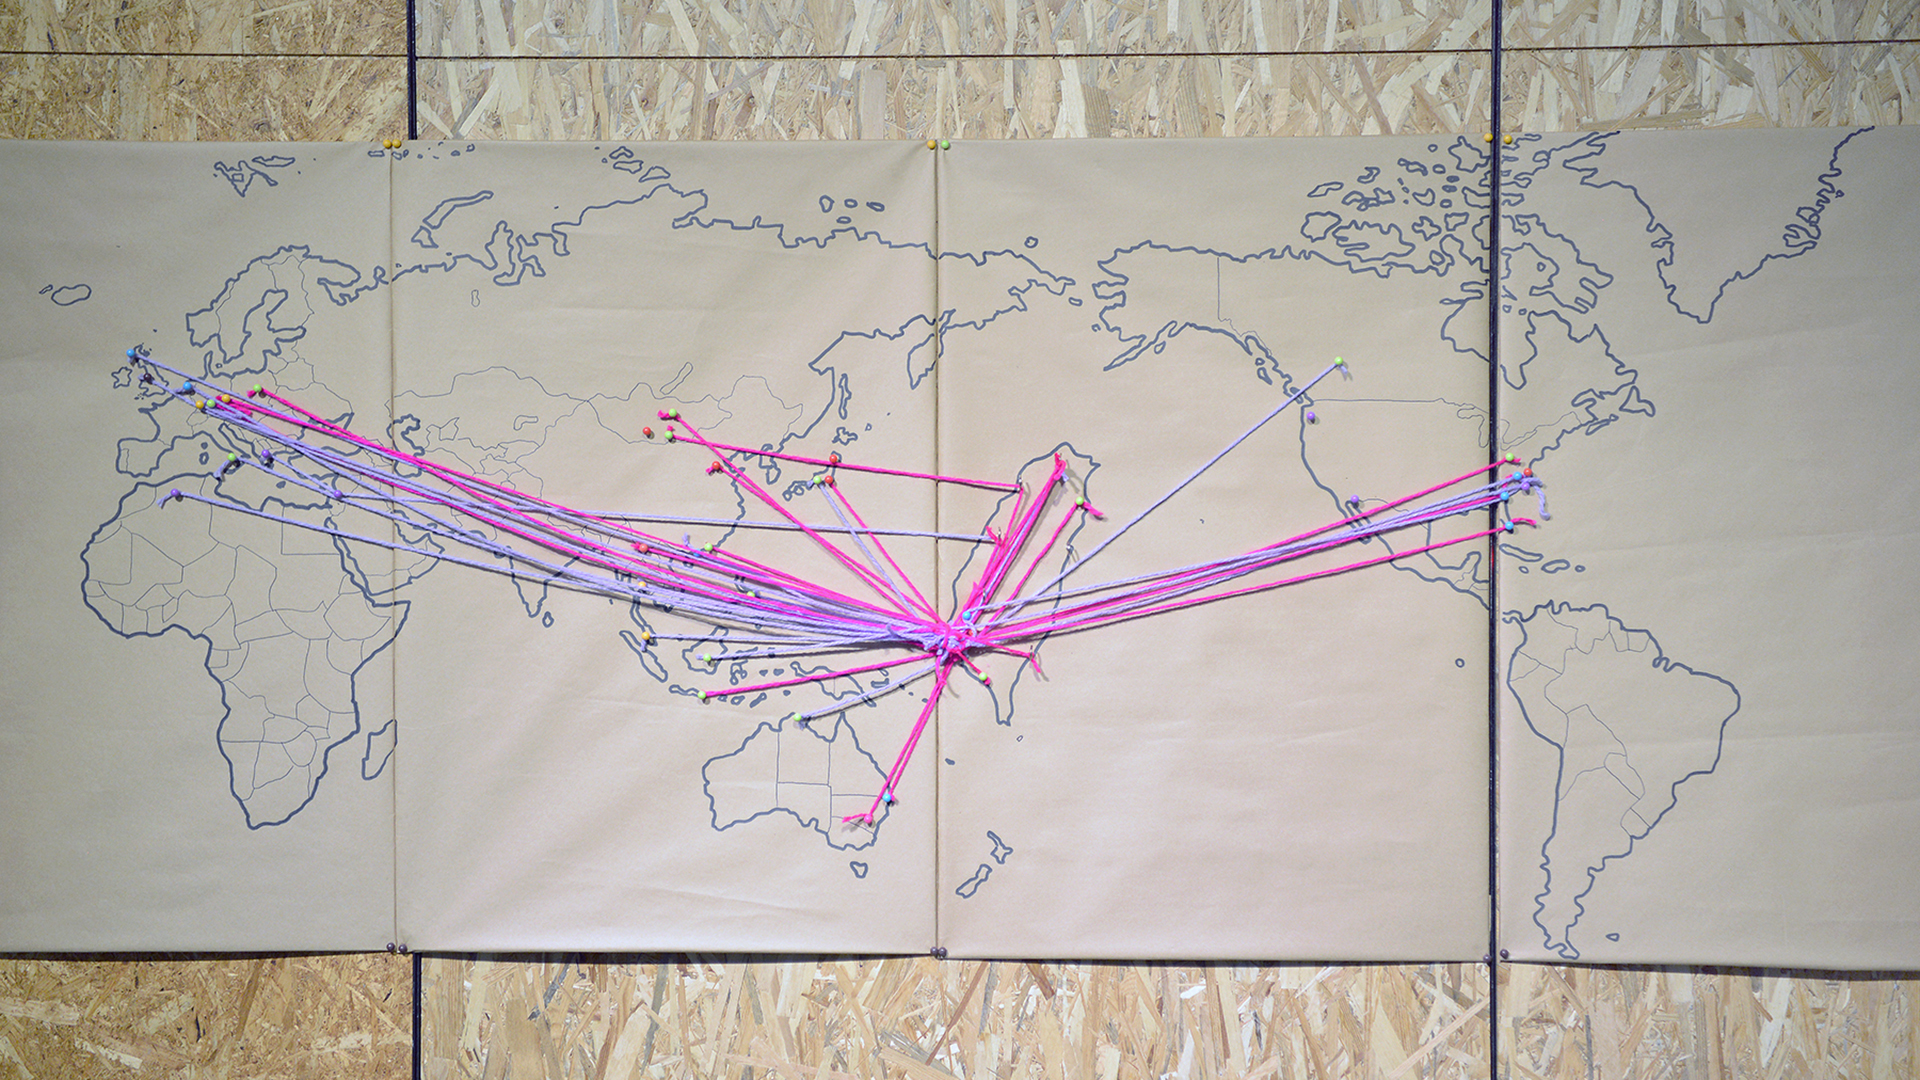
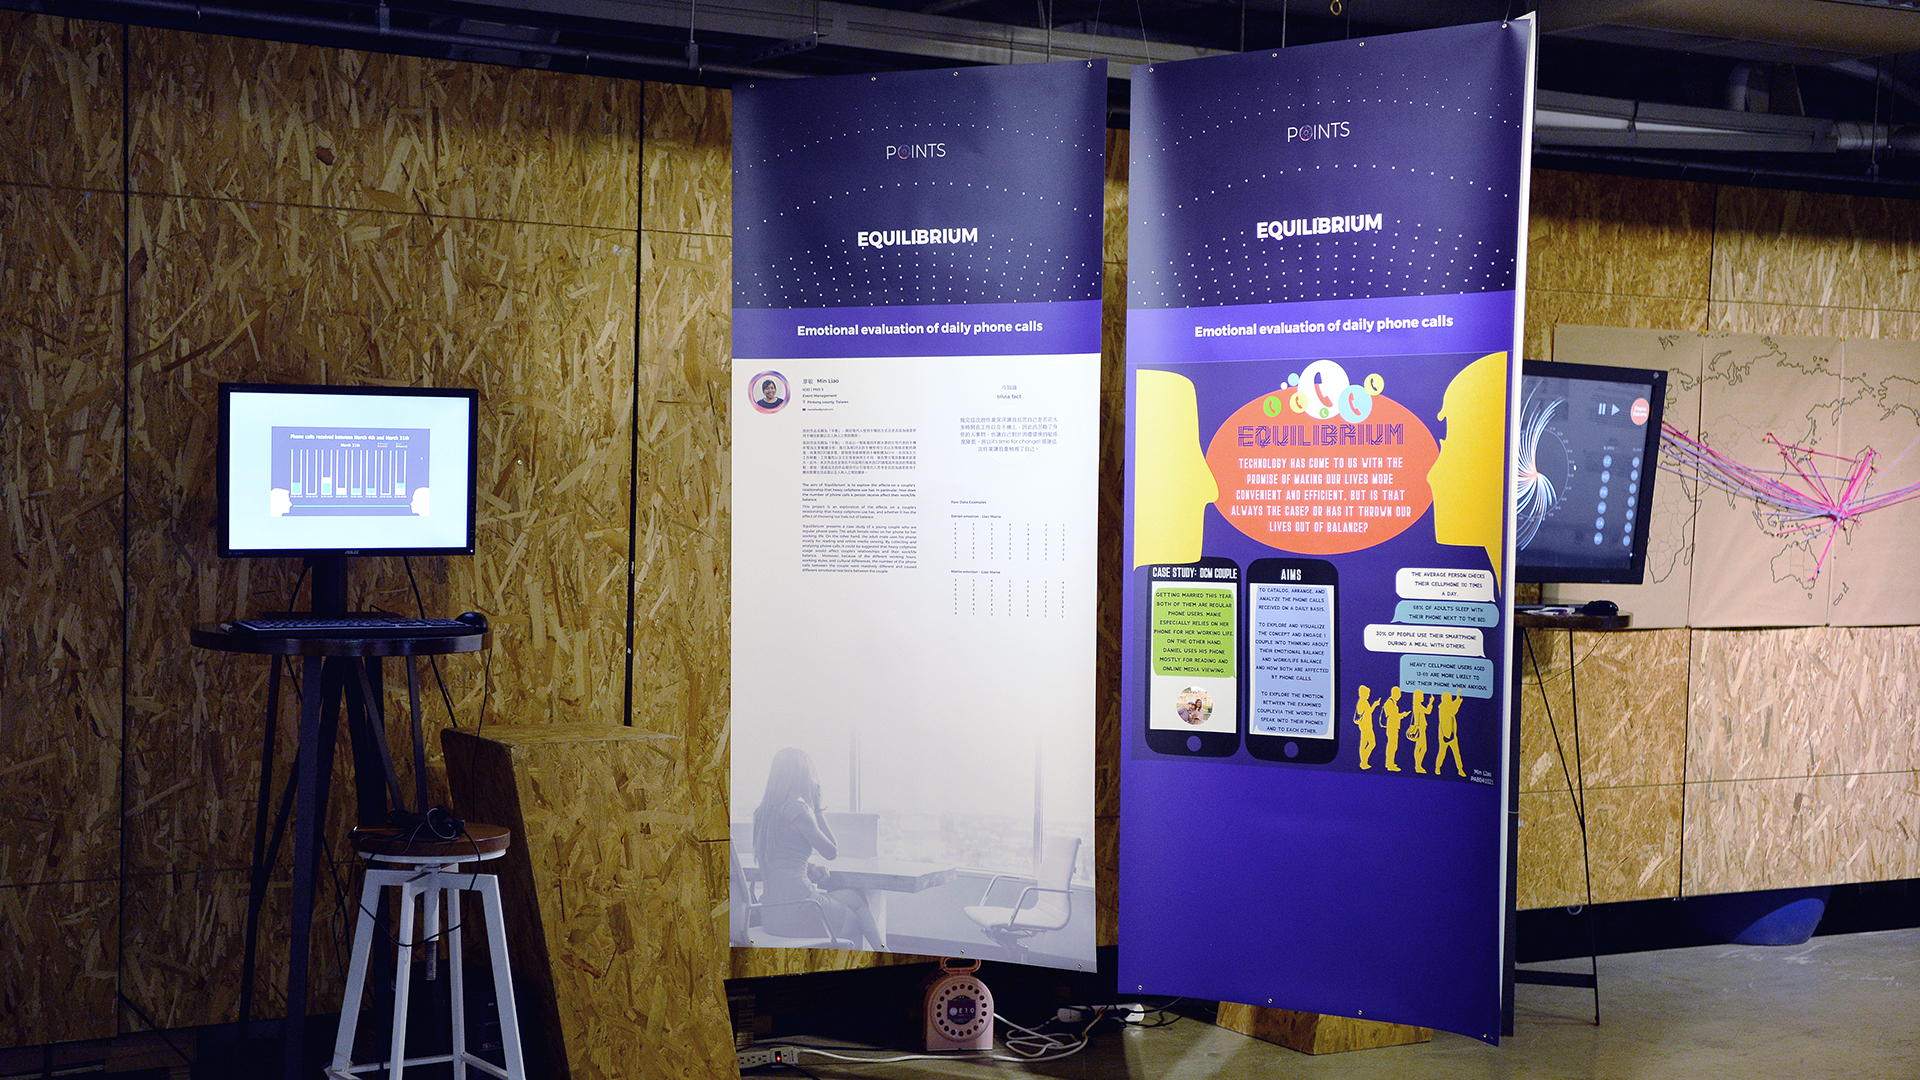
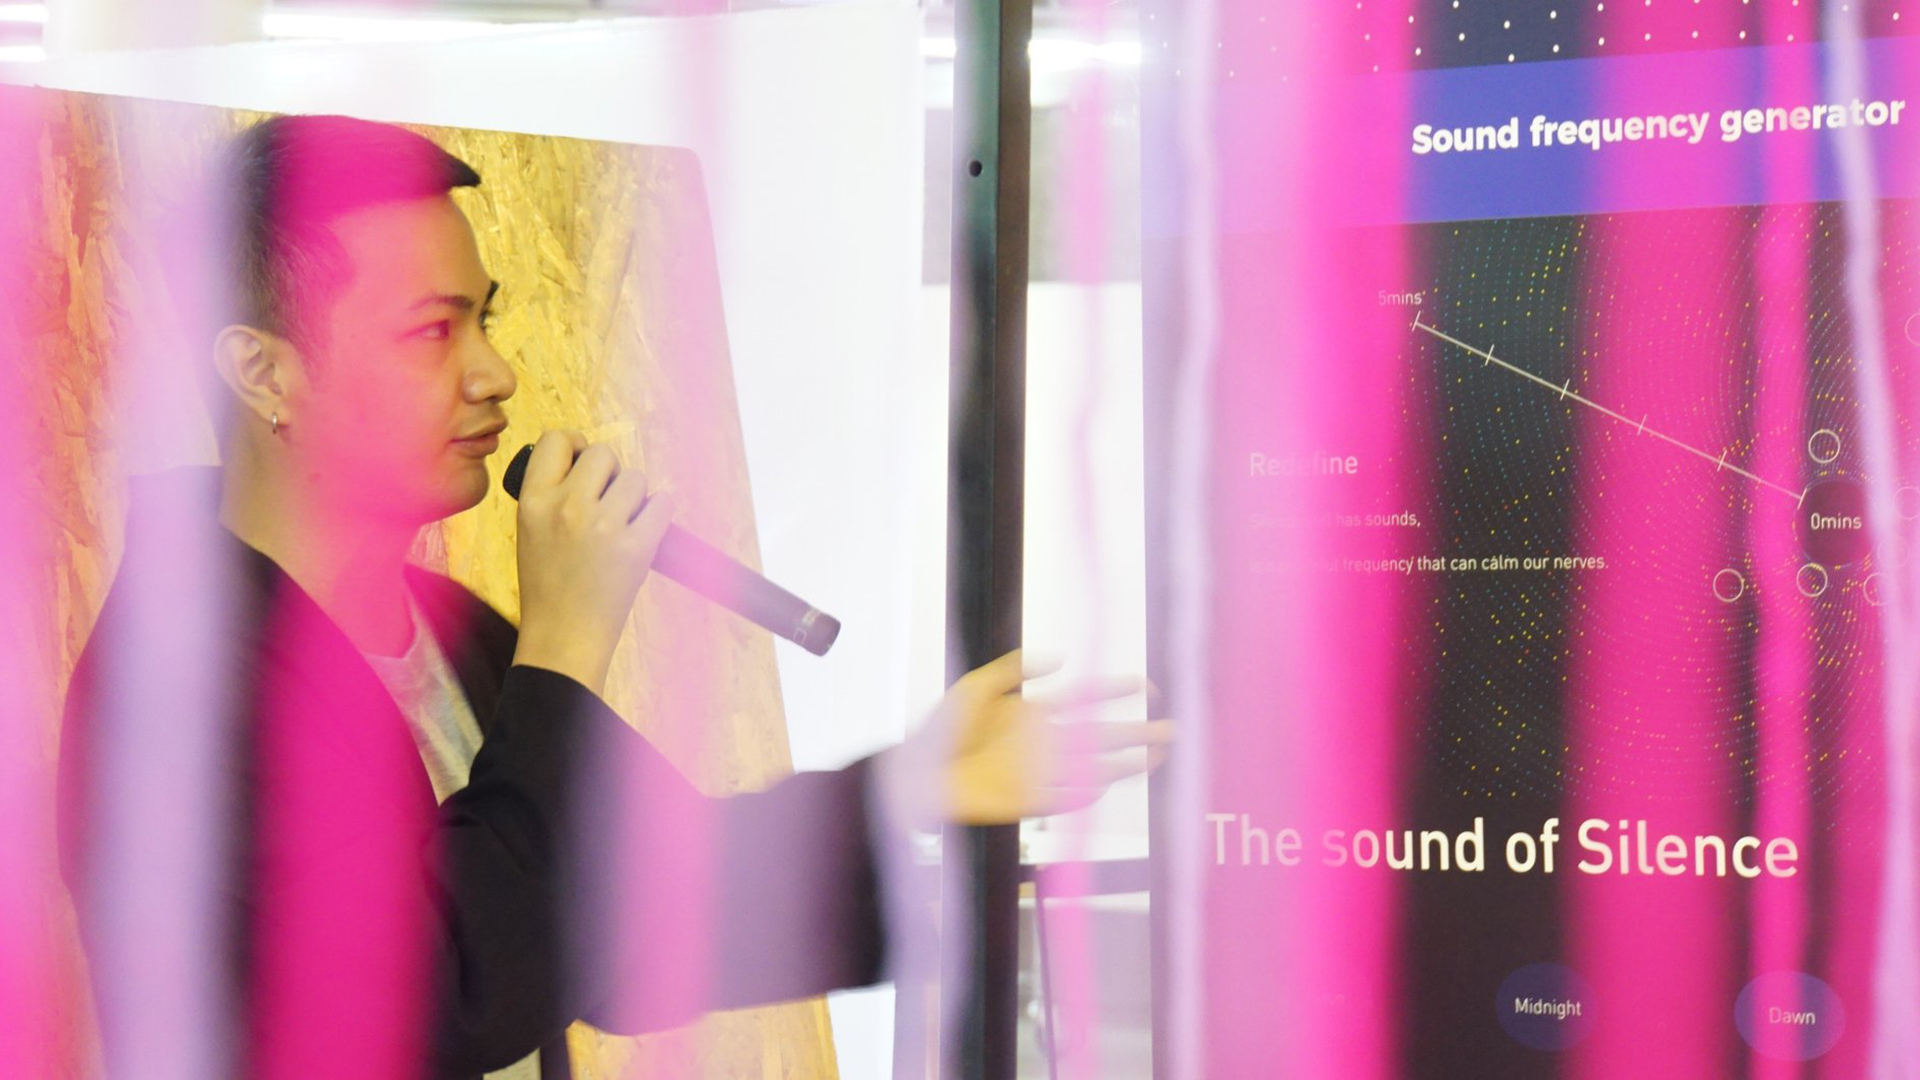
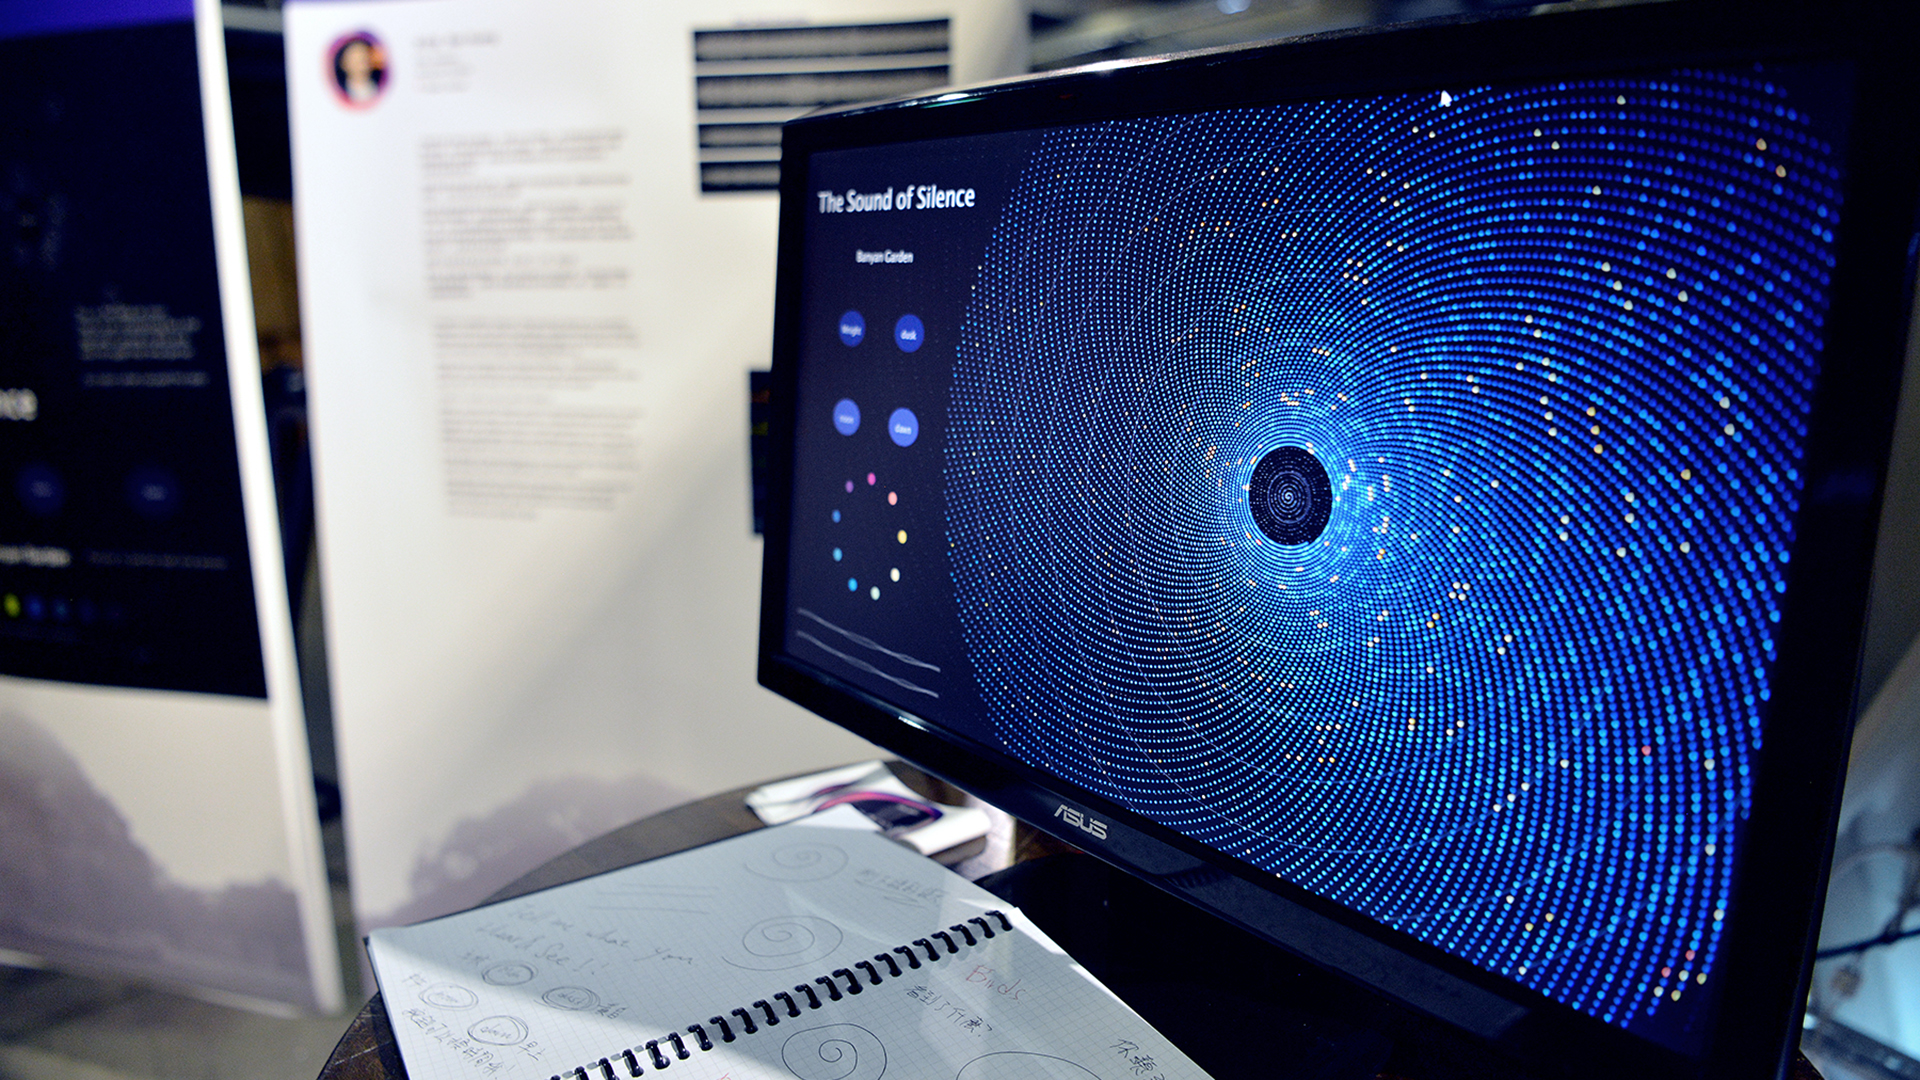
In order to make this trivial data tangible, a teacher and students from the Institute of Creative Industries Design and College of Planning and Design visualized the data in their everyday lives and presented them in interactive graphics displayed in an exhibit.
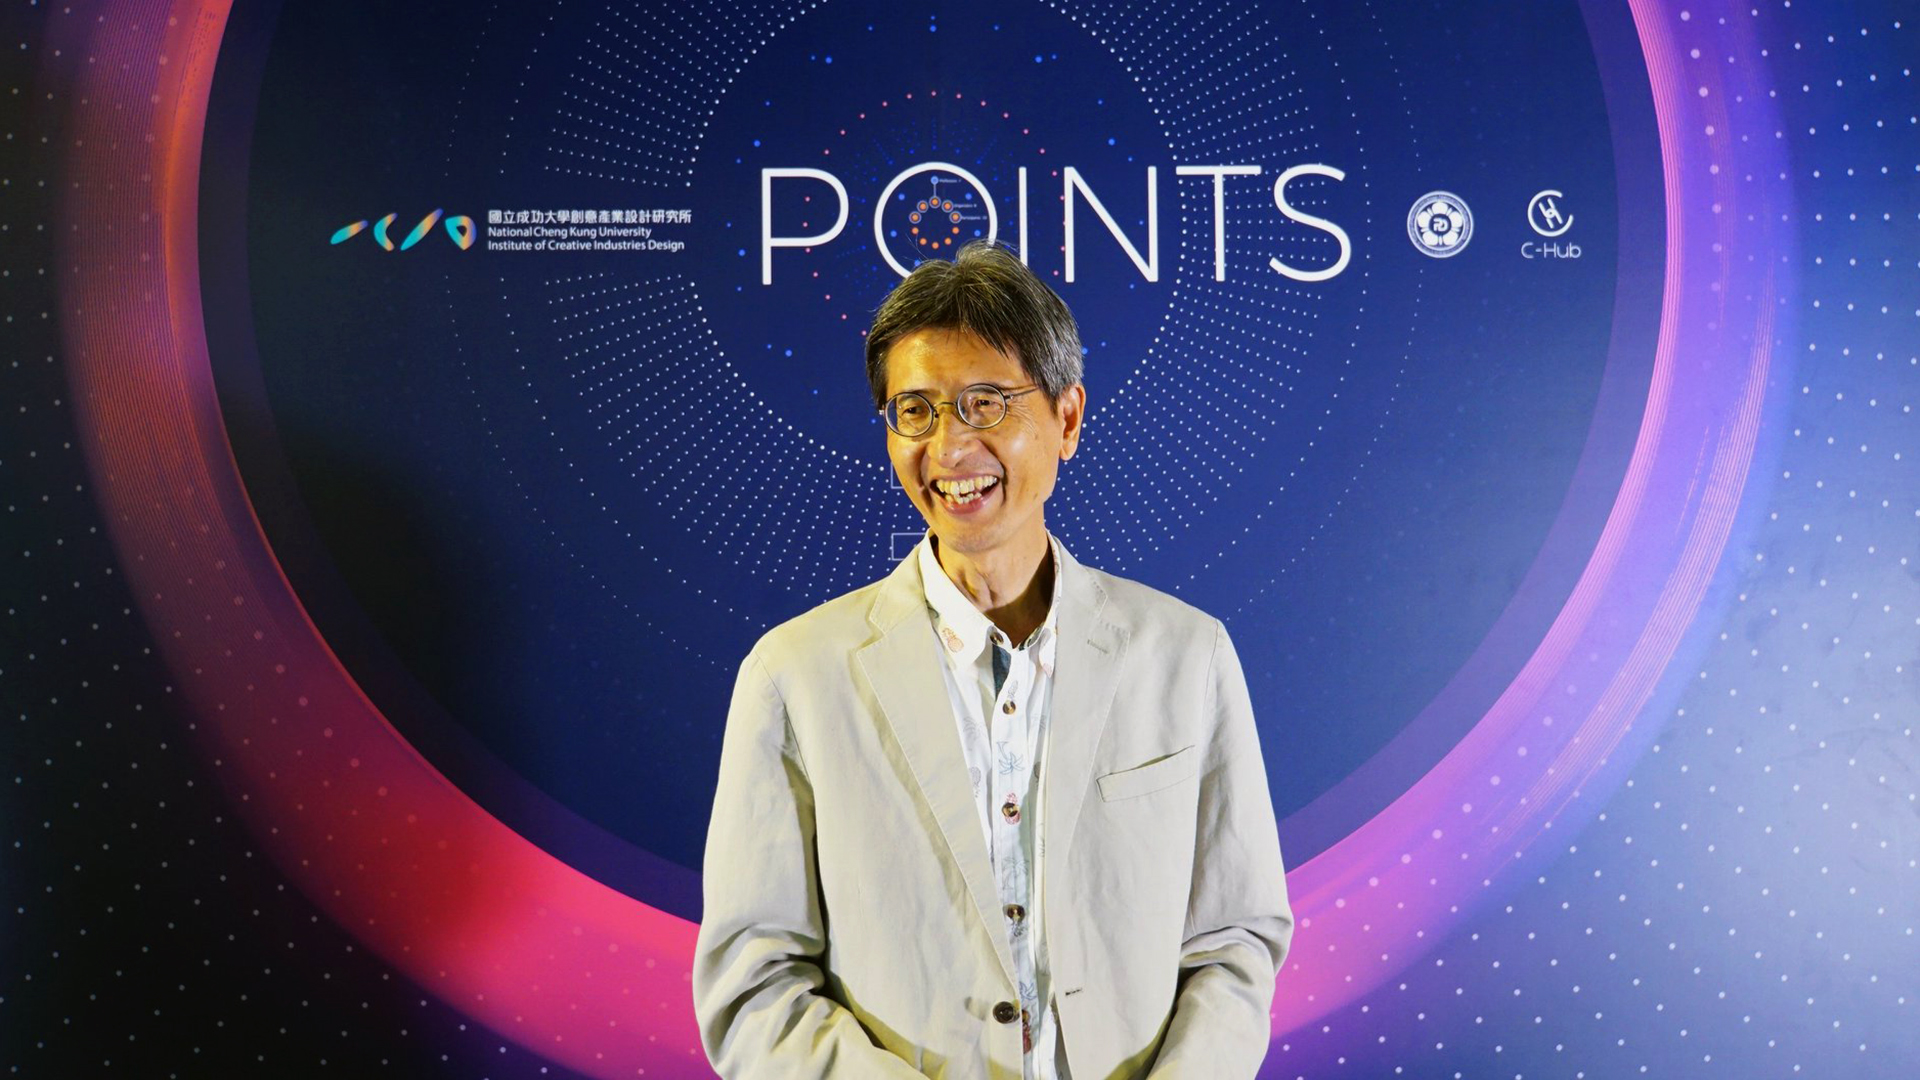
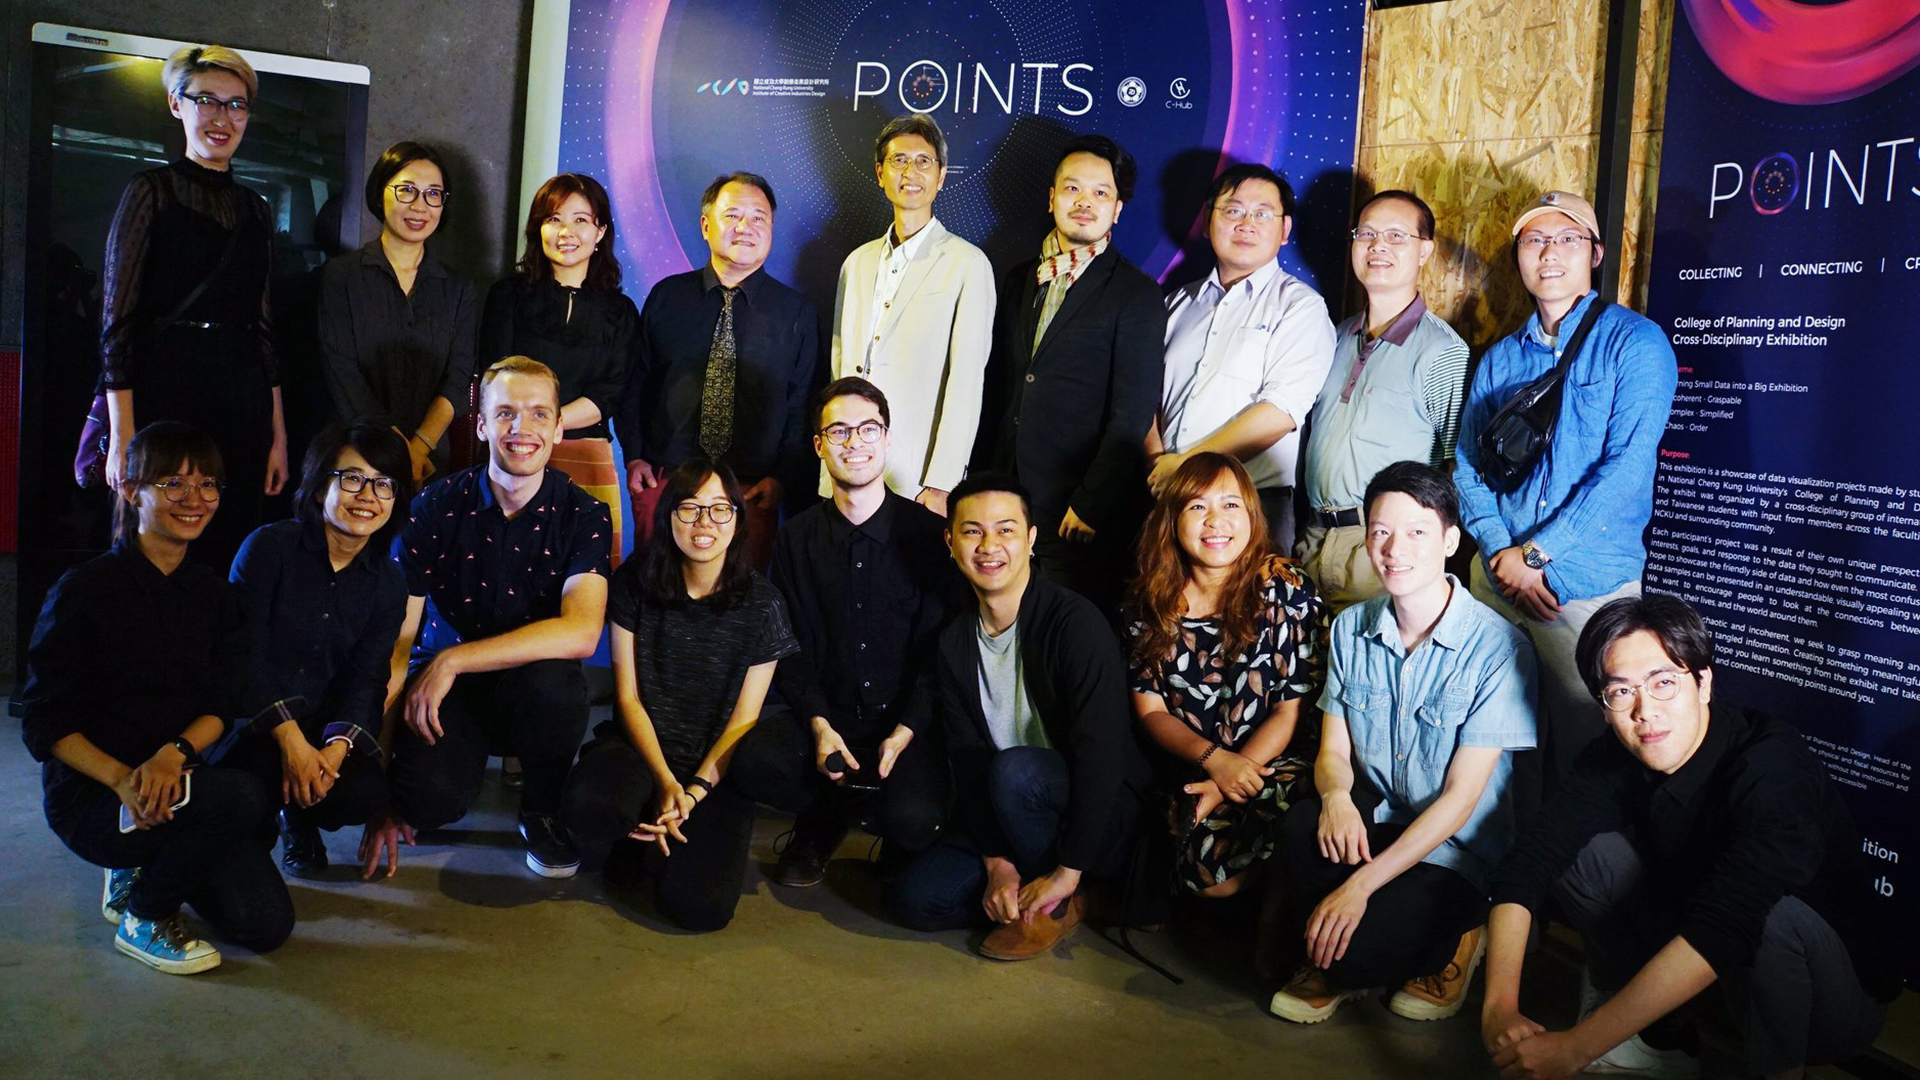
“盲點|POINTS” was a student-organized data visualization exhibition held in C-Hub at National Cheng Kung University from April 23 to April 27. During the opening, the Dean of the College of Planning and Design, Tai-Sheng Jeng (鄭泰昇), remarked that data visualization is a current trend and both a science and art. He hoped that the exhibition would lead the audience and more students to further understand data visualization.
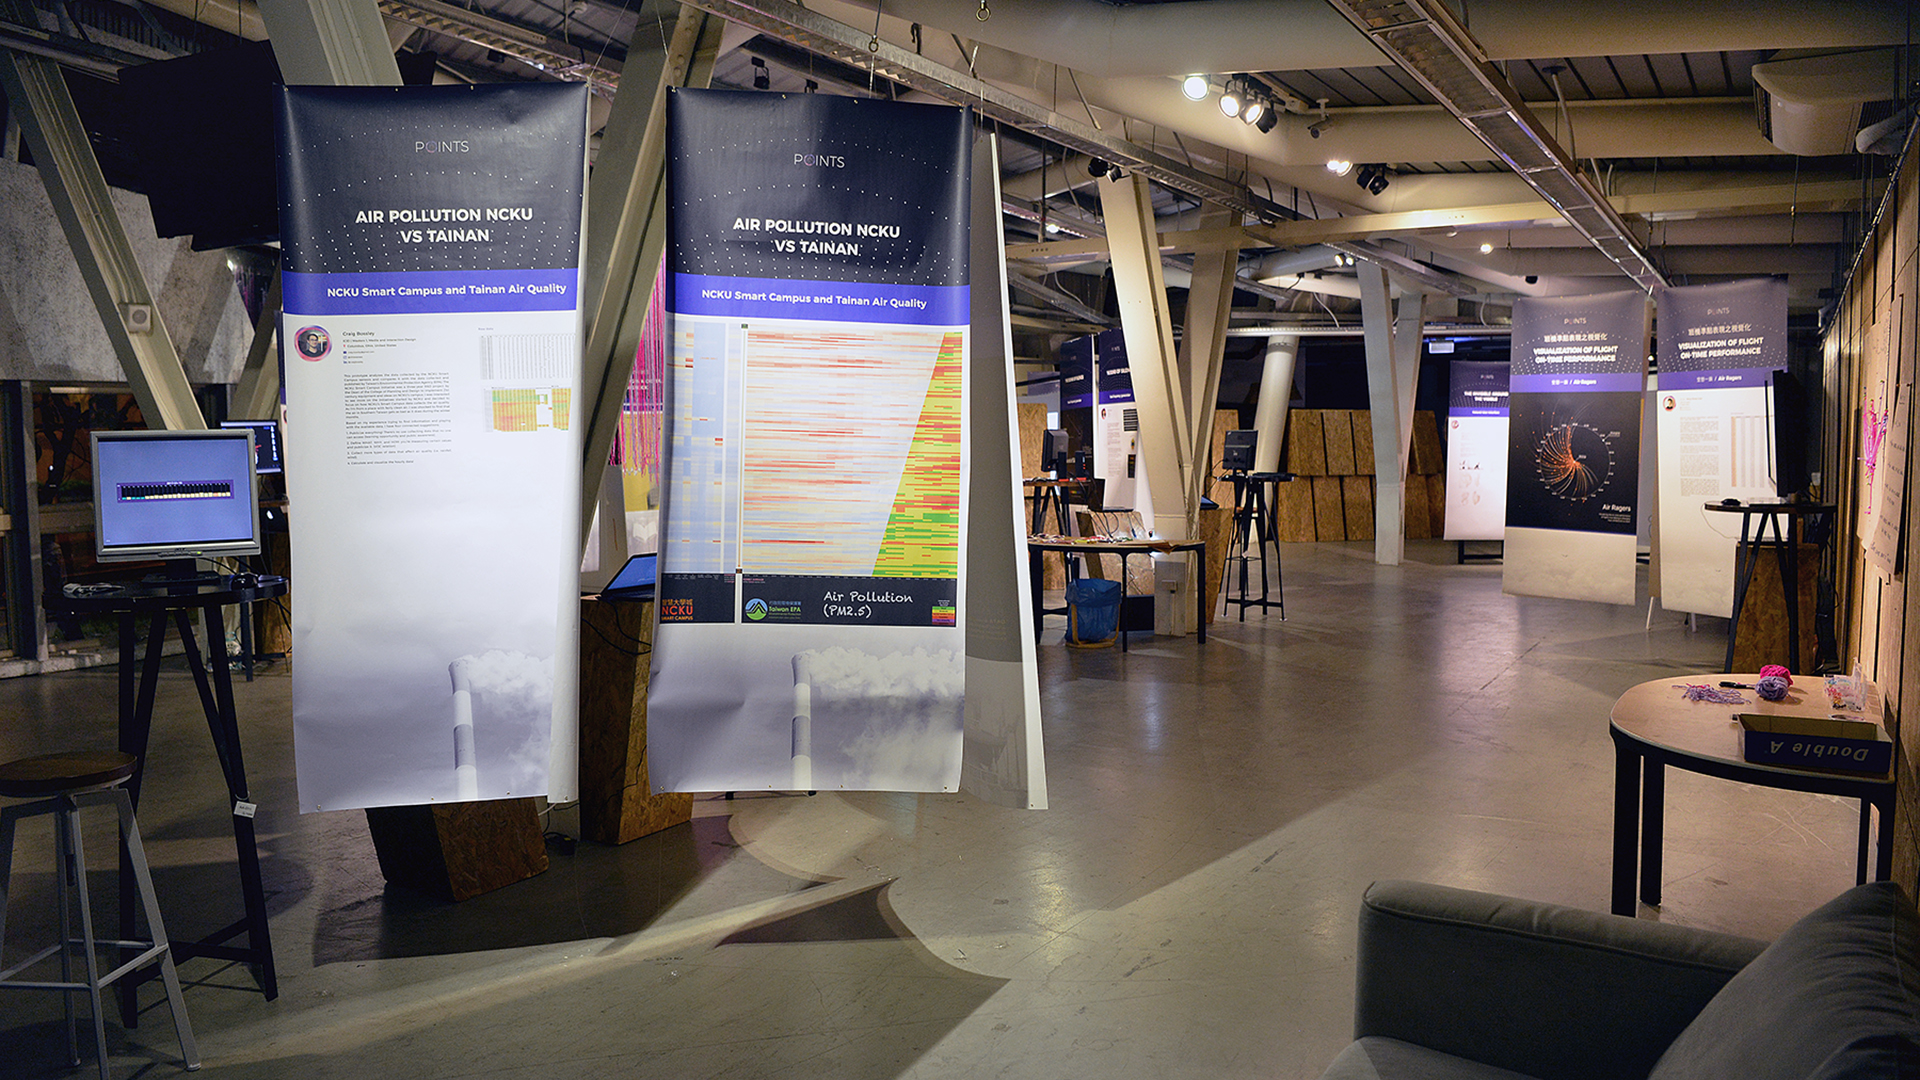
The theme of the exhibition was all-encompassing, highlighting the “blind spots” of life that often go unnoticed. One of the exhibition works, “Data Visualization”, used a running man to visually demonstrate the contrast between perception of data use with real use, while another, “Air Ragers”, systematically presented the flight delays of airlines between two major Chinese cities with orange lines. Other works like “Temple Map, Tainan” and “Air Pollution NCKU vs Tainan” collected enormous amounts of data on local life and activity but simplified them into clear and easy-to-understand charts. There was even “Story-making in a Digital Picture Book” which visualized participant suggestions and creativity to an interactive picture book. A broad range of attractive works were displayed at the exhibit.
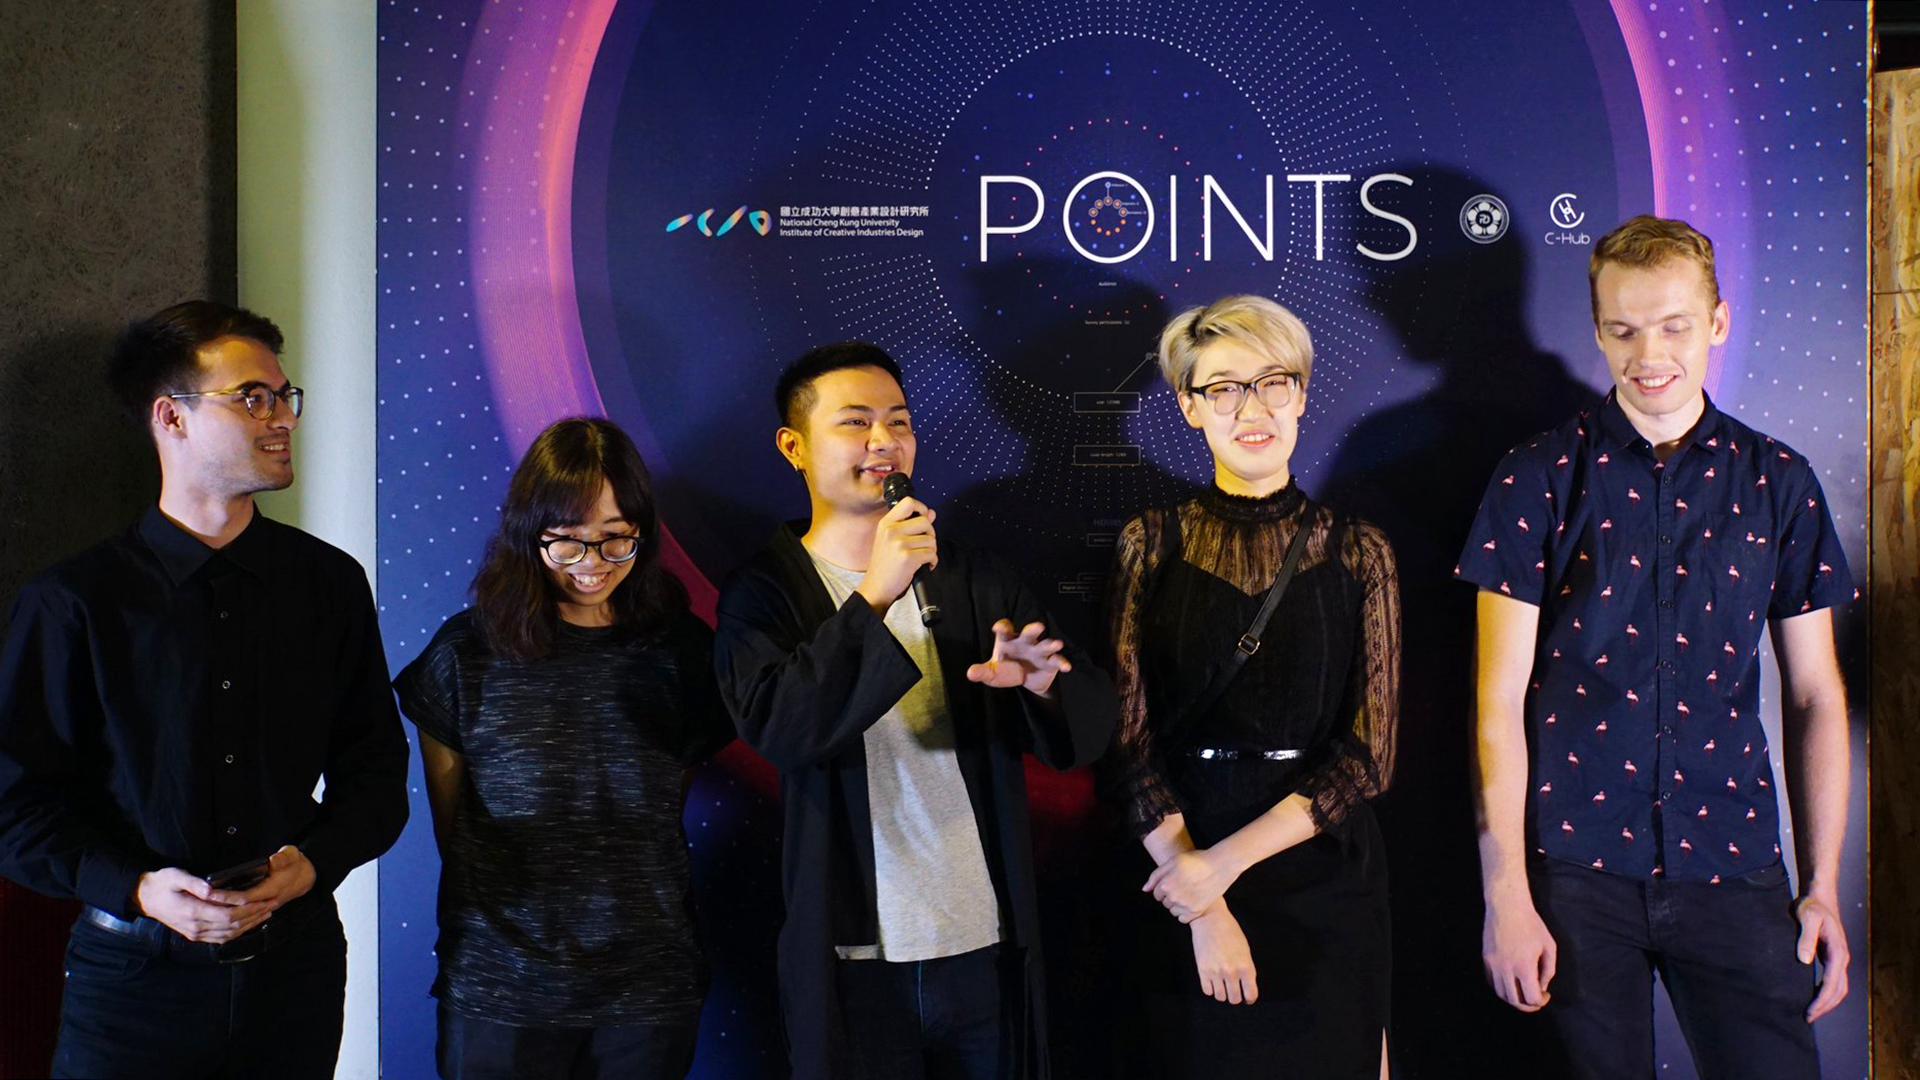
From ideation to execution, the exhibition and exhibit works were realized within the short time span of only a month and a half. Not only did the students have to collect their own data and visualize it, they also had to learn step-by-step how to use programming to complete their work. Craig Bossley (林彥明), a member of the organizing team, said that in addition to letting the public understand the meaning behind information, they also wanted to let people know that everyone has the ability to visualize data, because they themselves learned from scratch.
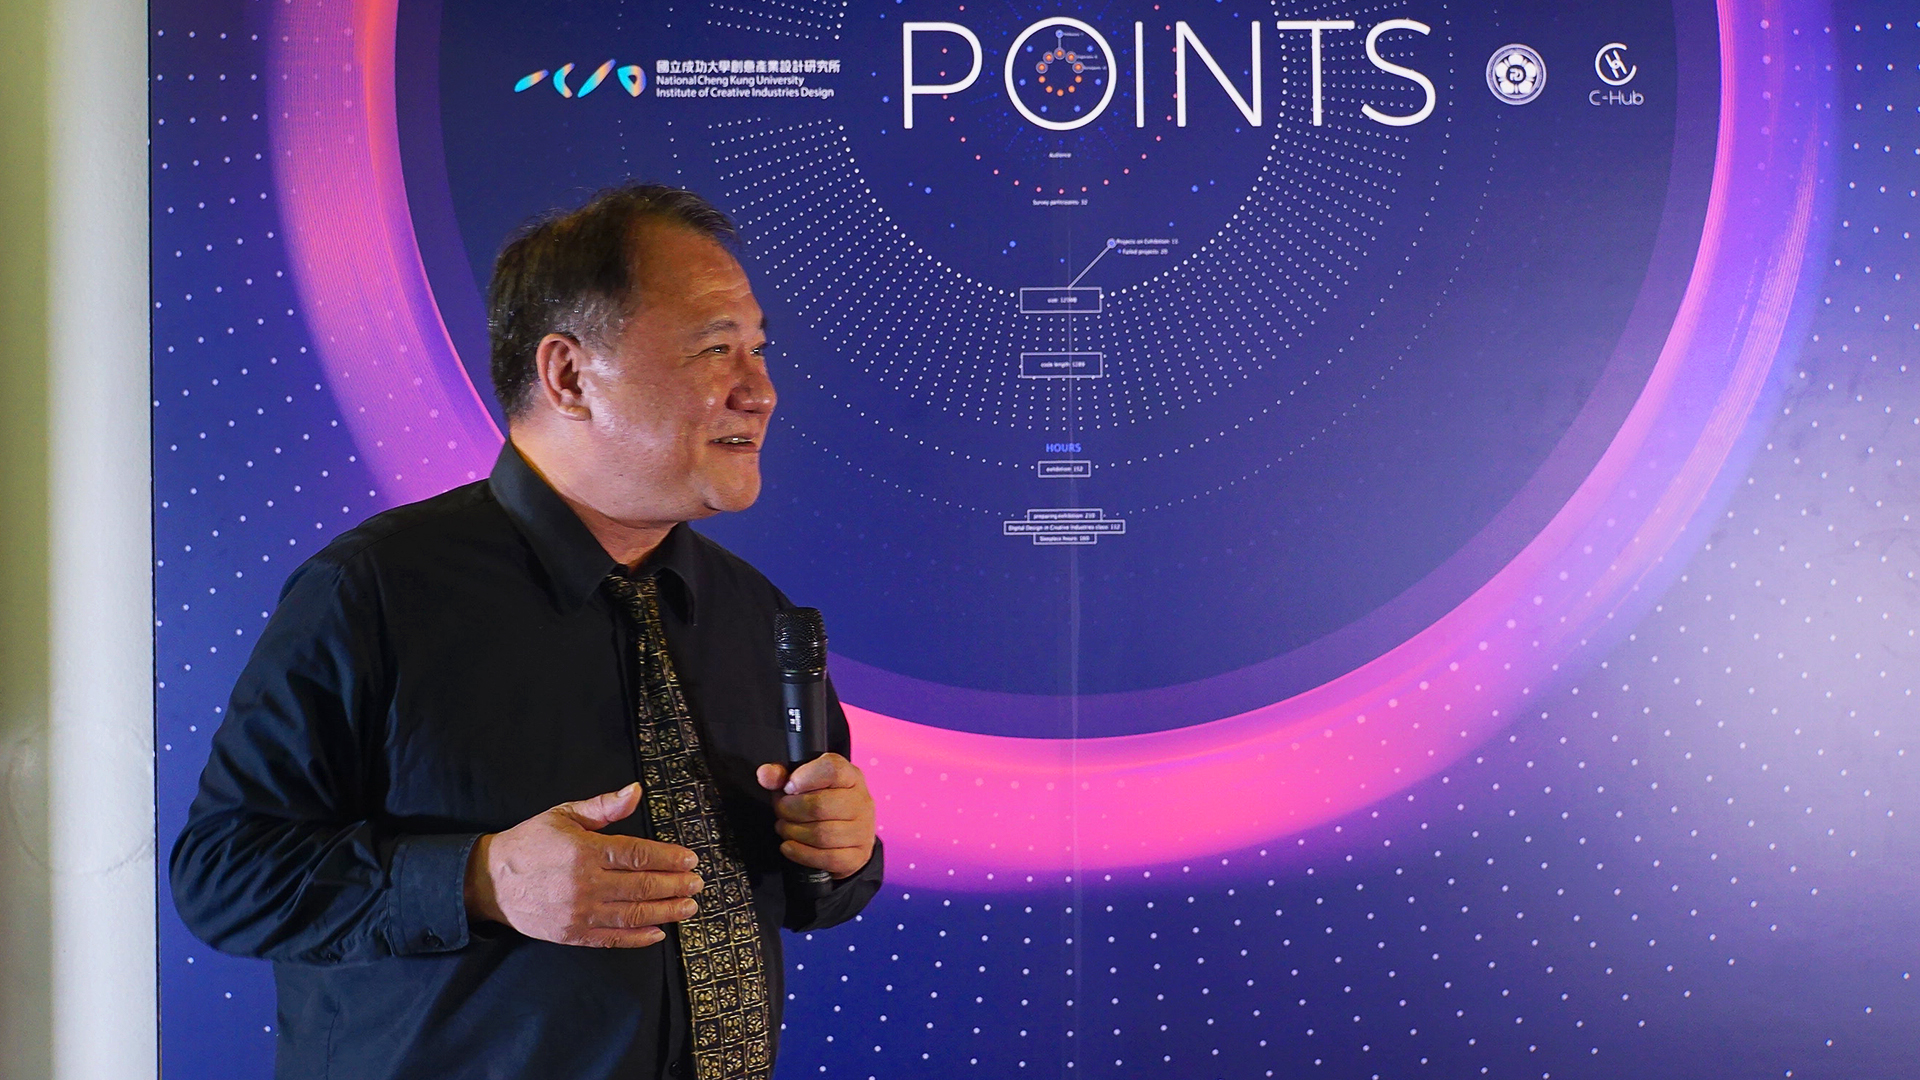
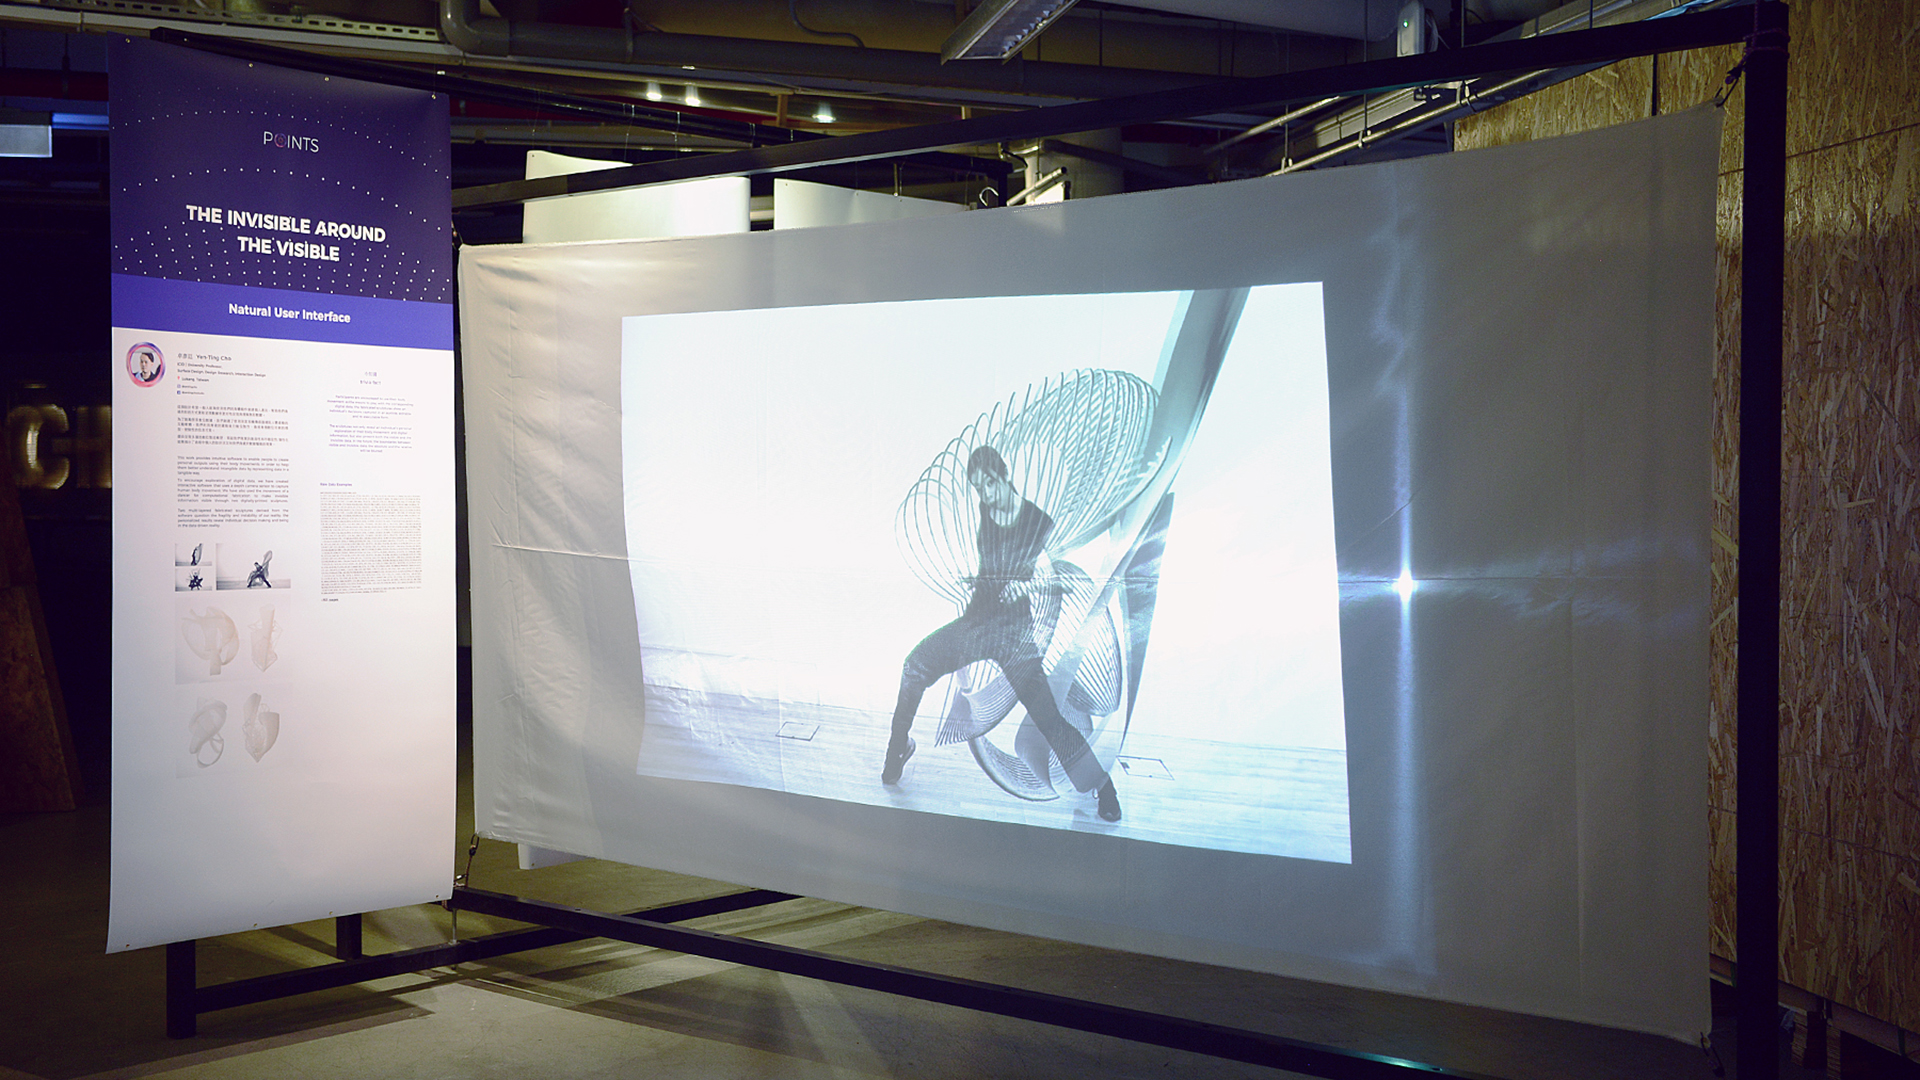
Regarding the application of data visualization, advising Professor Yen-Ting Cho (卓彥廷) said: “This exhibit has a very clear purpose, which is to let everyone know that its application is more than you can imagine.” Data visualization can be used in personal life, academic projects and creative artwork, such that one even has the opportunity of developing a computer application.
Acknowledgements:
Curation Guidance
Professor Yen-Ting Cho
Exhibition Credit
Curation Team – Craig Bossley, Sean Wanna, Yu Ching Chang, Ben Huang, Amarzaya Batdavaa
Administrative Coordination – Craig Bossley, Yu Ching Chang
Spatial Design – Sean Wanna
Visual Design – Amarzaya Batdavaa
Website Design – Ben Huang
Exhibition Assembly – Sean Wanna, Ben Huang, Yu Ching Chang, Aurora Yang, Pei-Yun Lu, Amber Lee, Wei-Cheng Chao
Branding and Marketing – Amarzaya Batdavaa
Film Production – Amarzaya Batdavaa
Financial Logistics – Yu Ching Chang
Academic Advisors
College of Planning and Design Dean Tai-Sheng Jeng, Institute of Creative Industries Design Chairman Shyn-nan Liou, Professor Ming Turner, Professor Faye J. Kao, Professor Hsiao-Ling Chung, Professor Hui-Wen Lin, Professor Chia-Han Yang
Sponsors
National Cheng Kung University College of Planning and Design
National Cheng Kung University Institute of Creative Industries Design